Turn satellite-observed crop condition, weather, and phenology into an early, plot-level view of how production is tracking against its own history, not a one-off snapshot or a regional average. See where crops are on track, showing strength, or starting to fall behind, without waiting for end-of-season harvest data.
Sourcing and procurement decisions are made months before final production numbers are known. Yet understanding how a crop is actually developing remains difficult.
Weather forecasts tell you about conditions. Satellite indices tell you about vegetation. Regional statistics provide the big picture. But teams still have to determine what those signals mean for production, and where within their supply base conditions are changing.
End-of-season reporting confirms what has already happened. It doesn’t provide the early signal needed to respond to production risk as the season develops.
Two plots only kilometers apart can be heading toward very different outcomes. Regional averages can obscure exactly the production areas that require attention, and when accumulated lead to a less accurate overall regional picture.
Weather, vegetation and crop-development signals are often viewed separately, leaving teams to interpret multiple parameters and determine their significance themselves.
As a result, sustainability and sourcing teams are left asking:

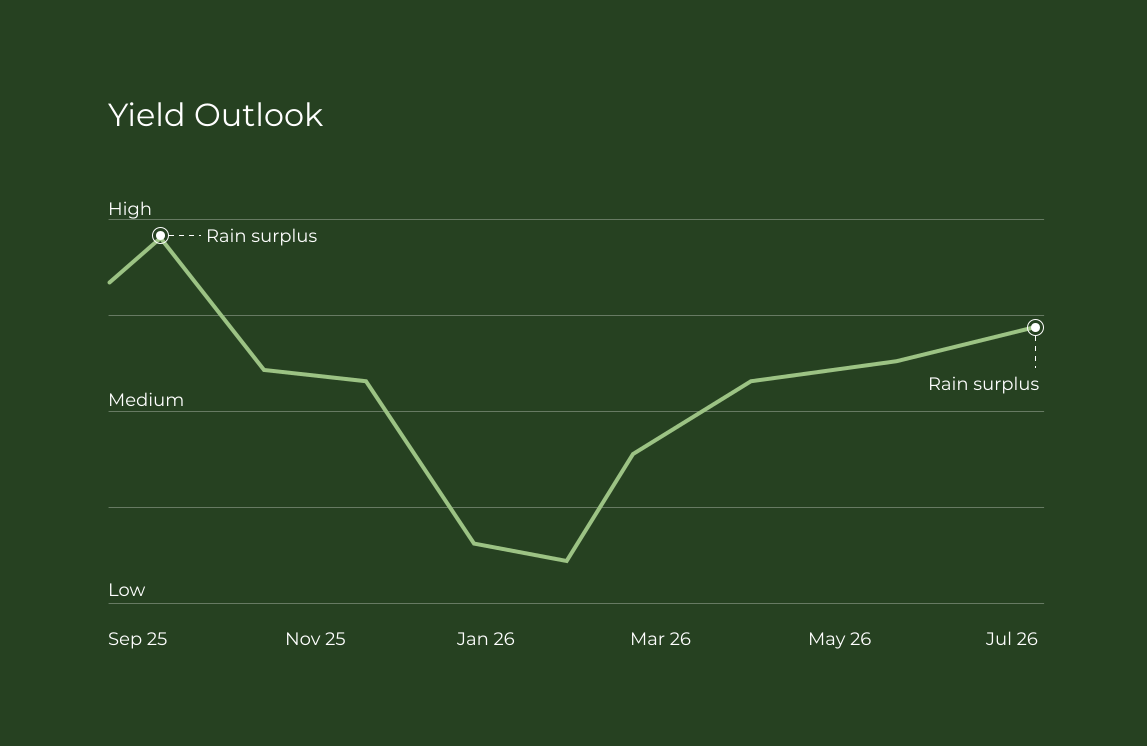

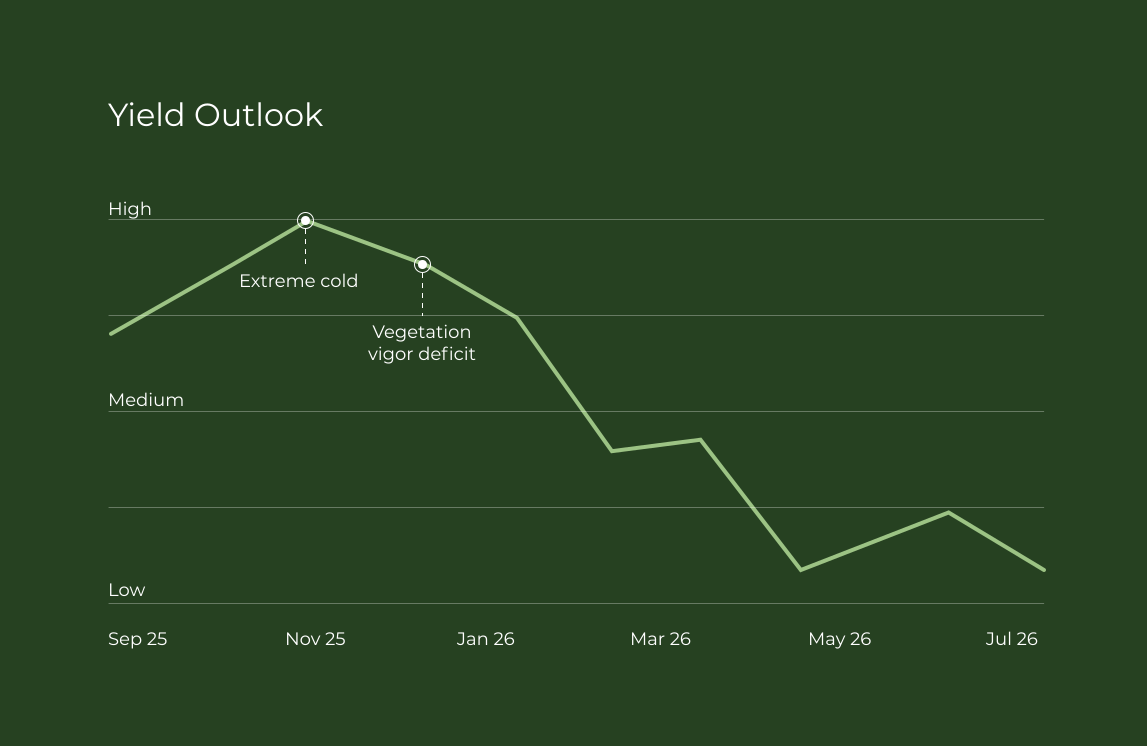
Bring satellite-observed crop condition, weather, and phenology together into one interpretable score showing whether each plot is tracking above, around, or below its historical baseline.
Follow how production is developing through regular updates, with each new reading building on the season to date to provide a stable view of where conditions are changing.
Interpret conditions in the context of the crop’s actual development stage, with crop-, species- and region-specific calibration where relevant — so differences in how crops respond to weather are reflected in the outlook.

For every plot, yield intelligence compares current crop and weather conditions with approximately ten years of that plot’s own history. It combines satellite-observed vegetation vigor, temperature, rainfall, and crop development stage to assess whether production is tracking above, around, or below its historical baseline.

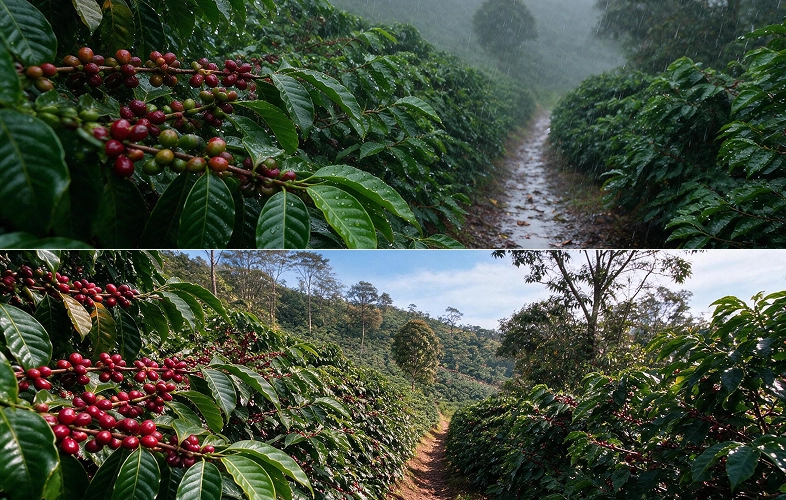

Temperature and rainfall are compared with historical conditions for the plot, helping identify weather stress that could affect crop development and production.
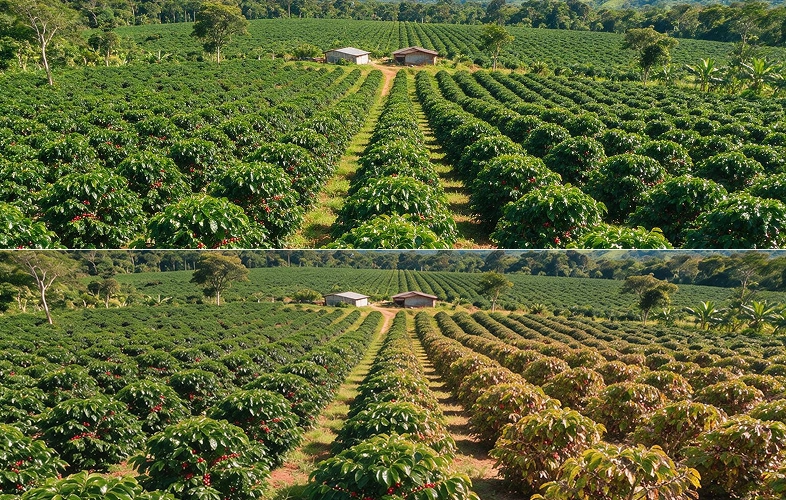
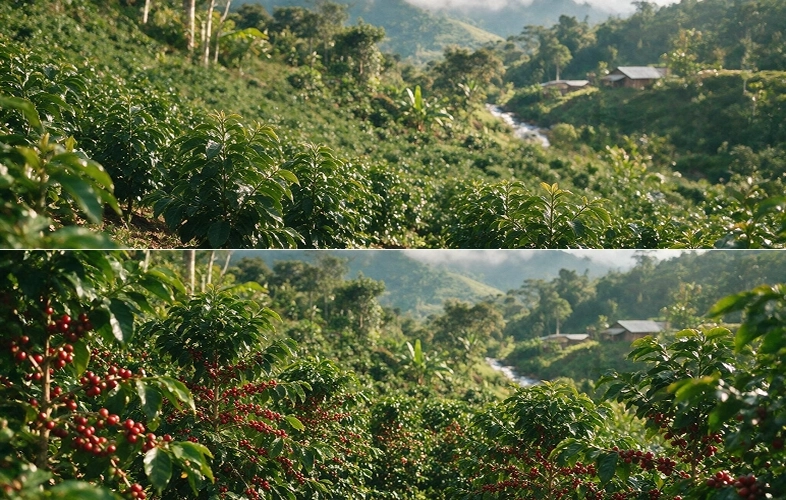

Satellite-derived vegetation vigor shows how the crop canopy is developing compared with its historical seasonal baseline. For dense crops such as coffee, the analysis can distinguish changes in crop condition even when the canopy is already very dense, where standard satellite vegetation measures can become less sensitive.
Growing Degree Days (GDD) are an established method for tracking crop development by measuring how much heat a crop accumulates over time. This allows yield intelligence to follow the crop in biological rather than calendar time. It helps determine whether weather stress occurs during a critical stage such as flowering, fruit or grain fill, or maturation — because the same event can have very different consequences depending on when it happens.
The relationship between these signals is calibrated for each crop and, where relevant, species and production region. Phenological windows, temperature thresholds and stress triggers are adapted rather than applying one generic model everywhere.
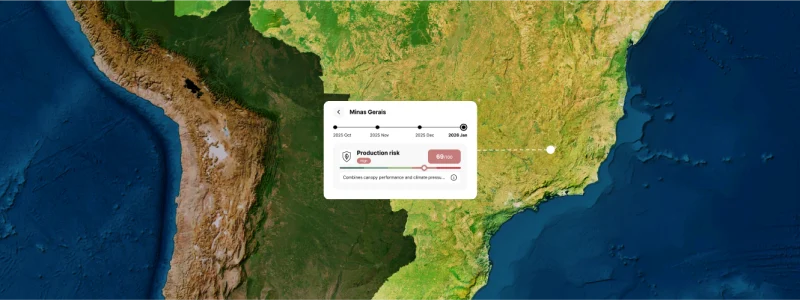
See how the current Brazilian coffee season is developing through our public showcase on Picterra Public Insights. The public view brings the underlying analysis to the municipality level, showing where coffee production is tracking strongly and where environmental conditions may signal emerging production risk.
Coffee Production Risk Brazil applies the Yield Outlook methodology, combining satellite-observed crop condition, weather, and crop development to provide an evolving view of production conditions throughout the season.
It is a solution that combines satellite-observed crop condition, weather, and crop development stage (phenology) to provide an early, plot-level view of how crop production is tracking compared to its historical baseline.
Traditional harvest data arrives after the season ends, when it is too late to react. Regional statistics average out large areas, hiding hyper-local performance. Crop yield intelligence delivers continuously updated, plot-by-plot insights during the growing season so teams can spot issues early.
It is built for sourcing and procurement teams, supply chain managers, and agricultural decision-makers who need early visibility into potential crop shortfalls or performance variations across their supply base.
Crop yield intelligence can be applied across perennial and annual crops through crop-specific calibration and validation, adapting to different growing cycles and production contexts.
Rather than viewing weather in isolation, the tool tracks Growing Degree Days (GDD) to evaluate weather events in biological time. This determines whether heat or water stress occurs during critical growth stages—such as flowering or grain fill—where damage is most likely to affect final yield.
No. The relationship between weather, crop condition, and phenology is specifically calibrated by crop type, species, and region to reflect how different crops respond to environmental stressors.
No. The platform translates complex, disparate data streams—such as weather maps, satellite indices, and phenological models—into a single interpretable tracking score.
The outlook updates continuously throughout the growing season. Each new reading builds on previous data to maintain a stable, reliable trend line rather than overreacting to single-month anomalies.